Showing posts with label mathematics. Show all posts

Tuesday, 24 February 2015

Morning Maths - or - Finding the nerdy side of Covet Fashion

My friend D spent the week-end with me and we had a wonderful time having the most girliest week-end ever with baking Nutella-bread, watching "Gift vid första ögon kastet" (Married at first sight) and playing Mortal Kombat X


During the week-end D had also introduced me to a game called Covet Fashion and on Monday morning she came to the breakfast table with a thoughtful look on her face and asked the question

"How many votes on average does my look get per event?"

Wednesday, 12 February 2014

Why not? Because it's freaking me out! + some Downtonomics

Sooo, I just wanted to share a quick film clip that I enjoyed. Brings back lovely memories of my modern geometry course...


And here is a link to the economics of Downton Abbey.

Downton

Friday, 15 November 2013

Epic Split - Viral clip

One of the new top viral videos is not about cute cats or kids doing what kids do. No, instead it is an amazing advertisement stunt performed by Jean-Claude Van Damme for Volvo Trucks with over 8 million views in two days. Below is the clip:


It is one of the few advertisements I have seen where the stunt has enhanced the product so much I have actually looked up the company. In this case I wanted to find out who had developed this technology and proceeded with my Googling and LinkedIn snooping. (There is probably several confused LinkedIn members wondering what I was doing on their profile).

I didn't find much. Either Volvo Trucks is making sure they don't lose their developers by hiding them or I suck at looking up development teams.

  • I found a job advertisement deadline the 20th for those who are interested
  • There were at least two people, Jan-Inge Svensson and Sten Ragnhult, both senior engineers, who have worked on it.
  • The project is most probably based in Gothenburg
  • Both of the engineers have Facebook
If anyone knows more be sure to tell me, it would be very interesting to know how they developed this amazing technology, the calculation models and how long it took to develop.

I also enjoyed they two different ways they market the same product in different countries. Go to UK's specification for the Truck FM and you will get a 2 page spread of Volvo Dynamic Steering (VDS) with pictures, compared to Sweden's three sentences:. 
One page of UK's two-page specification concerning VDS

Sweden's complete specification concerning VDS
The press release concerning it can be found here. And just to end with a snapshot: from the clip:


Monday, 26 August 2013

Female mathematicians

Google "female mathematicians" and you will get lists of women mathematicians through the ages, historical female mathematicians and famous female mathematicians


Google "male mathematicians" and suddenly the Google page is littered with "the 10 best mathematicians", "list of mathematicians" and my favourite, "The 30 Greatest mathematicians"


A closer look at the "The 30 Greatest mathematicians" link and one of the top 30 is female but it is pretty clear that the majority is male and "mathematician" seems equivalent to "male mathematician" in everyday terms. I therefore want to dedicate this post to those few female mathematicians who I've stumbled across in my short life.

Margarita

Margarita was the person who first introduced me to mathematical proofs and it is from her I learnt the delight of being able to understand the reasoning behind the theorems that is otherwise just learnt by rote. 
In the midst of all the changes to the Mathematics Program at LiTH she was steadfast in making sure that all future young mathematicians would have a good theoretical base to rely on and I can do nothing else than thank for that steadfastness as it so clearly helped me in my future studies. 


Milagros

Modern geometry is not my cup of tea, but I still wanted to mention Milagros in this post. I therefore asked my friend J, who has had the pleasure of knowing her better than I do.

Milagros works on the geometry of Riemann surfaces: their moduli and symmetries. This is a wonderfully rich area, thanks largely to "the miraculous trinity". Namely, the following collections of objects are in a suitable sense the same:
  • compact surfaces considered up to angle-preserving maps,
  • non-singular complex algebraic curves, and
  • complex function fields of transcendence degree one.
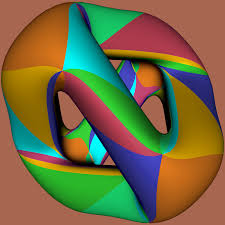
This circle of ideas is immensely fruitful, and connects classical topics in geometry and function theory with number theory and theoretical physics. A central concern in modern geometry (and mathematics generally) is to study collections of all possible objects of a certain kind. Such a collection can often be given the structure of a suitably generalized "space" which can then be investigated geometrically. This is then called a moduli space. With various coauthors, Milagros has studied the geometry of moduli spaces of Riemann surfaces with certain extra properties. For example, questions about which kinds of symmetries of the surfaces are compatible with each other translate to questions about the connectedness of "branch loci" in a moduli space.

Some restrict their investigations to contrived objects, narrowly defined so as to admit the application of whatever trick the researcher intends to apply. This can produce PhDs, but is bad mathematics. By contrast, Milagros' work applies a variety of methods to truly natural and important questions. It is mathematics likely to last.


Åsa

When I was doing my thesis for my bachelor I had Åsa as my mentor and those conversations that I had with was very focused on my own work. But a few weeks before I presented my thesis, I had the pleasure of being able to listen to her licentiate presentation. (Licentiate in Sweden is approximately half a doctorate). Her report was called "Dose Plan Optimization in HDR Brachytherapy using Penalties- Properties and Extensions" and a link to her work can be found here. I will try to give a short presentation of it in layman terms.

HDR Branchytherapy is form radiotherapy where the radioactive substance is placed in or near the tumour that is to be treated. Optimization is now generally used when planning where and how long the radioactive substance should be placed.
The difficulty lies in that in this planning you want to make sure that the tumour receives the most radiation and minimizing the radiation to other healthy tissue. This means trying to balance length of time the substance is placed in one place (dwell point) and trying to find several dwell points so that the whole tumour is affected by the radiation. One problem that has been observed with the optimization model is that it would often present results with few dwell points and long time in these spots which would create "hot spots" which is something that you want to avoid.

Her presentation was about analysing the actual optimization model that is being used to find out why the model would give these types of solutions. What she found was that the way linear penalties were used in this optimization model was a cause to the unwanted long dwelling times, and then presented some ways to adapt the model. Now that, is pretty awesome stuff!

Friday, 16 August 2013

Cluster Analysis

At work I have been clearing out some old papers and by the end of the day I went to my boss and handed over(dumped) the files and paper that were still of importance to him. He looks at them and sighs. But then his face lights up and says

"Well I've got something for you too!"

Some rummaging and he hands over some photocopied sheets of exercises that have an air of statistics. I am used to receiving random math assignments from him, as his daughter is at the moment studying a technical program at university and he will often come to me to discuss some of the more interesting exercises that he helps her with. I have always recognised the topic, which has meant it has been fun to discuss the subject and compare the difference in educational focus of what he studied many years back and my recent studies in them. But today was different. The following question was presented to me:

"Utför hierarkisk klustring på följande datamängd, först med strategin "närmaste närmaste punkt" och sedan med strategin "närmaste mest avlägsen punkt". Rita de resulterande dendrogrammen och förklara skillnaden."

Roughly translated this becomes:

"Perform hierarchical clustering on the following data set, first using the "nearest neigbour" method and then the "furthest neighbour" method. Draw the resulting dendrogram and explain the difference"

And this was the data-set:


Neither I nor my boss have seen this type of questions before so we had some fun presenting different types of theories to each other with no actual knowledge of the subject. After a while though, we both wanted to actually know what cluster analysis is and the answer to the question.. I proceeded to Google cluster analysis, and after watching a Youtube video by a Mr. Ray Cooksey, skimming through some articles and finding a very good paper going through the basics of Cluster analysis, I was hooked! I managed to explain the difference of the methods to my boss and continued my research in to non-hierarchical clustering.

Definitely a good ending to a work week...

Wednesday, 14 August 2013

New Job

I sent the final signed contract today and in about a month's time I will be starting my new job as Data Analyst at Carlson Rezidor Hotel Group. I'm super excited!

A short summary for those who are interested: Carlson Rezidor Hotel Group owns, among others, Radisson Blu and Park Inn hotels across the world. I will be working for the Nordic team with data and optimization. What more could a mathematician wish for!


I will not be saying any more other than I have been finding some very interesting articles concerning the subject I will be working with. I think it is soon time for me to head over to the university library to find some dissertations...and also start brushing up on my favourite subject...non-linear optimization.

Tuesday, 16 July 2013

Strategy Analyst, John Gower

Todays post is by guest blogger John Gower about his journey to becoming a Strategy Analyst. John is an analyst at NerdWallet. If you have any questions for him, please post in the comment section below.


Life as a Strategy Analyst
When I started college, I was actually thinking I would major in math. I started out taking calculus courses, and my first semester I also had a statistics course. I enjoyed calculus a lot, although I already knew that I would since I took AP calculus in high school, but I realized that I also loved statistics. What I love about it is that statistics offer such a concise way to understand the world and visualize complex trends. After that first semester, I started thinking more about math and what I wanted to do with it and it dawned on me that I didn’t even have a reason for going into math other than the fact that I had always been good at it. I visited an advisor at the beginning of my second semester and she suggested a few majors, but the one that caught my attention was actuarial sciences.
I’m lucky that the University of Wisconsin—my alma mater—has such a strong actuarial sciences program because otherwise I might have ended up somewhere totally different! Once I declared my major, I branched out from math classes to take economics, business, finance, and accounting classes. I will say that business is not my favorite subject (it’s a major filled with hyper-extroverts), but even though I had mixed feelings about it, it was a great experience for learning to work with different types of people. And honestly, learning to work with business-types has been one of the most beneficial things I’ve done in terms of my career. Of course, I also took general education requirements. Although composition was another skill I wasn’t eager to acquire, learning how to express myself in writing has—clearly!—become an important part of my life.

Career
As a strategy analyst, my work covers a lot of territory. A strategy analyst is kind of like the navigator for a business, or maybe even like the person on a ship sitting up in the crow’s nest keeping an eye out for things on the horizon. My job involves working with business to analyze trends and optimize their processes. So, I have to think about what issues are going to affect them in the future. Is there a new technology that will disrupt the business in terms of what customers want or how the business is run? Strategy analysts combine this statistics-based fortune telling with a bit of business analysis and sometimes even some project management to make sure the business stays on course and doesn’t run aground on anything unexpected. If I’ve done my job right, when a new trend or technology hits the scene, I’ll have predicted it (in a general sense; I’m not a wizard), and the business will already have plans in place to deal with it.

Models
It’s a little cliché, but I have had great success working with Porter’s Five Forces Analysis model. This model has been around since 1979 (although it has since been updated), which makes it sound like it should be old and irrelevant, but it has held up quite well. The basic premise of this model is that a business has to manage supply and demand to make a profit and it explicates the five forces that act on the balance of supply and demand. For example, new entrants to the marketplace, increased (or decreased) bargaining power from customers or suppliers, the presence of knock-offs, and competition among firms can all destabilize the current status quo. These five forces are an excellent guideline for anyone working in strategic analysis because they help you identify potential threats and opportunities before they arise.

I’ve enjoyed work as a strategy analyst—it satisfied my desire to analyze numbers and use them to make predicts and recognize larger patterns.  I would definitely recommend you explore this career further!
John Gower is an analyst for NerdWallet, a personal finance website dedicated to helping you save money with tips on everything from work to the best CD rate.


Monday, 15 July 2013

Statistics about the mathematics program

Last week students who have applied to university programs and courses received the admission decision from the universities across Sweden. Having had a special interest in the mathematics program I decided to do some follow-up on the number of application across some of the universities. First a diagram of total number of applications across the universities, Gothenburg University, Lund University, Stockholm University and Linköping University. These numbers include both applications to programs and courses.

Now the total number of applications to the maths program at the different universities. Please note that Stockholm has 4 different mathematics program, and I have only included the one called "Kandidatprogram i Matematik" as it seemed to be the one best suited to compare with the other universities. Lund has also this year, two separate maths program, called "Naturvetenskapligt kandidatprogram, Matematik (undervisning på engelska)" and "Naturvetenskapligt kandidatprogram, Matematik" which I have counted as one program, with the only difference is seemingly the language.


  I then weighted the number of applications to the Maths program with the total number of applications to the university:


Linköping is doing well with the number of applications, but what I really want to get my hands on is some drop-off numbers, that is to say, the number of students who don't complete the program. I would like to see if the drop-off numbers are decreasing, and also how the other universities are dealing with drop-off's from their programs... If anyone knows how to get their hands on that information, please contact me :)

Sunday, 7 July 2013

Wedding Anniversary and Travel optimization

Today is our one-year wedding anniversary and we will be celebrating it by putting together a wardrobe for our bedroom and going out to eat. Nothing brings two people closer like putting together IKEA furniture...

Anywho, in other news; Matte and I were discussing the pay-off of traveling when considering changing modes of transport and total time spent travelling in public transport.

Let's assume that all distances have no monetary cost difference. That is to say travelling by one mode of transport from A to B costs exactly the same as changing mode of transport several times and traveling from A to C to D etc to B. This is the case when travelling with a monthly boarding pass within the city boundaries. Let us also assume people don't enjoy travelling and nor do the enjoy changing modes of transport. What aspects would once have to consider to create a good goal function?

In layman terms, will a person choose to travel a certain route from A to B if the total travel time is longer but there are less changes of mode of transport? Which aspects will effect the person's decision?

Some of the thoughts Matte and I had that would effect the decision was:

Risk
How long time is there between the changes?
Is there a chance of missing one of the changes?
How often do the transport come if you do miss a step of the way? Is it every half hour or every 5 minutes?

Regularity
Is it a one-off trip or one that is done regularly? Will a one-off trip be more sensitive to changes or not?

Total time
Is the total trip time short or long? Will a 5 minute increase in the time be weighted more on the 15 minute trip than the 1 hour trip?

Number of changes
Is each increase in the number of changes weighted the same? Is an increase from 0 to 1 weighted more than from 1 to 2?

I'm itching to create some optimization functions now...Anyone else have ideas of what could effect the decisions?

Lastly is a short video of 2 people zorbing. I couldn't get anyone to film us when we rolled down so this video will have to do. As you can hardly see the people in the ball, you can imagine it is Matte and I :)


Saturday, 18 May 2013

Stereotypes and Leadership

The PewGlobal recently published an article about a poll conducted in several countries and where they have concentrated on the European Union. Now I love statistics, and although I have little trust in surveys, preferring cold hard facts, I love the graphs that can be generated from the answers. My favourites in this article, are one concerning Leadership role and Stereotypes.


The graph above concerns what people think about whether their own leader has done a good job in dealing with the economic crisis. In all the countries excepting Germany, the percentage is below 40 making it visible that there is little trust from the citizens in how they believe their own leaders has handled the situation. Whether that is the case is, of course, not possible to determine as this is as survey that measures what people think. What people think is not always the same as what is the fact. 

Now what I like is the next graph that takes the though one step further in the leadership role. People are not only asked whether their own leader does a good job with handling the crisis, they are asked if Merkel, Hollande and Cameron have done a good job with handling the crisis.


In all countries except Greece, they give Merkel a higher mark then their own leader, and both Hollande and Cameron has had a positive trend where only 2 countries have given their own leaders a higher score.

The graph below is my absolute favourite. It concerns what people think about each other which is always of interest to me. I will leave the graph to speak for itself as I believe most people will love to delve in to the different meanings it could have.


I will also post last years survey about the Stereotypes, The headings are different but are still fun to compare with.:


I did a quick search to see if I could find anything about Sweden's stereotypes but could not find anything. If anyone has any information on where I could get hold of that, you are very welcome to contact me.


Friday, 17 May 2013

Blog statistics

Well, yesterday was an interesting day. I usually have a steady flow of 30-50 visits to my blog. This is what I expect as when I write, I write to my friends, family and anyone who would ever want to Google the subjects I touch (although I end up way to low on the search engines for people to find me).

Yesterday was record. I had 240 page-views, whereof 190 were unique visitors. The closest I've come to that level of visits was my Going Viral blog-post which has had 125 page visits. I guess the gender issue is a much hotter subject than statistics :-)


Wednesday, 17 April 2013

Fun with statistics

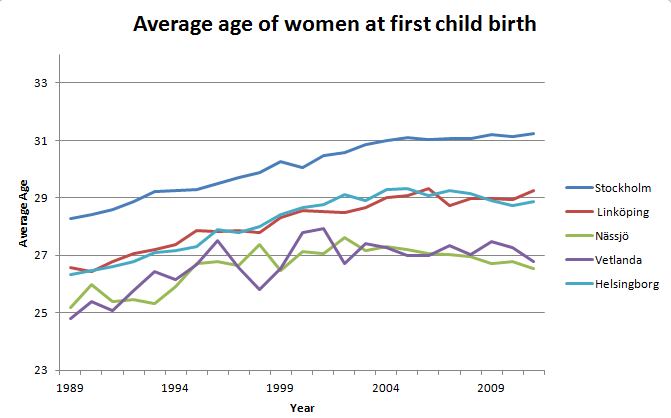
At the Turkish wedding that I was at last Saturday, I met a lot of women my age. It was nice to talk some Turkish again although I did notice one thing that I wasn't expecting. For each person that I met, as soon as they found out I was married, they asked me where my children were.This insight in what expectations there are on a young woman made me want to look up some comparison between Sweden and Turkey when it comes to average age for a woman's first child.

This turned out to be harder than I expected. Swedes have a bit of a fetish when it comes to statistics which means when it comes to data concerning Swedes there is LOADS! Statistiska Centralbyrån (meaning the Central Bureaucracy for Statistics) have an absolutely wonderful website for all those gory details that everyone wants to know about. I easily found out that the average age for the women having their first child in Stockholm as of 2011 is 31,24 years and it has risen from 28,42 since 1990.


Finding this information for the Turkish population was not easy. After a few rounds googling, clicking around different reports and reading references, I found the Turkish Journal of Population Studies located at Hacettepe University. It distinctly specifies that it was founded to meet the deficit in the field of population science. It has interesting reports and studies but no database where you can extract the information that you want. In the end, all I could find was median numbers which specified that across the ages of population 25-49, the average age of women for their first child was about 21,3 in 1998, 21.8 in year 2003 and 22,3 in 2008 (Linear growth!) I cannot compare median numbers with average numbers so instead I'll just include the nice excel graph I created using the data from the Statistiska Centralbyrån.
Average age of women at first child birth comparison Stokholm, Linköping, Helsingborg

If anyone knows where I can get average numbers for the Turkish population, especially divided by district please contact me, would love to know :-)

Tuesday, 16 April 2013

Search Engine Optimization

Second year at uni I studied a course called Advanced Linear Algebra. Being a very theoretical course and many non pure-math students there, one of the first questions that naturally came up was "What can you use this for?" The professor lit up and answered that Google uses it in their ranking system and is one of the reasons to why it is so successful. Being a second year math student, no more interest was given to this answer other than surprise that theoretical maths was actually being used outside uni life. I enjoyed the course as the professor was inspiring and the course layout meant that we could spend a lot of time delving in to the understanding of the course.

google search algorithm funny


A few years has past since that course and I have found I am more and more interested in how social media works and how information is spread. A few days ago I wrote about Going viral and lately I have been doing quite a bit of reading about Search Engine Optimization (SEO).

When I started to looking around for what SEO is, the main definition I could find was that it is the art of optimizing a website so it shows up with a high ranking on search engines. But skimming through the SEO theory blog, I found this theory which I like better:

"The use or application of algorithms to influence the predictable content and quality of search engine results according to the chosen criteria of the optimizer."

It is, I think, a better description of what SEO's do as they do not only analyze the content of the website but also how search engines algorithms work, how the public search for information and how competing companies portray their own information.

SEO in simple terms funny

While surfing this topic I also stumbled across Search Engine Optimization - Starter Guide written by Google which was very interesting. Very helpful tips on what to think about when designing a website including best practices, sitemaps and mobile directing.

Monday, 15 April 2013

The story behind my economic interest

When I was at my first year at high school I had already completed the basic level of Maths and most of the required level of English. After one term I was studying grade D Maths and had completed all the required English. This left me with a lot of spare time that I tried filling with other courses that the school could offer. The courses I chose were German (which I failed) Programming (which I loved because of the teacher) and Accounting. This was a pivotal course for me. Not because it was something I enjoyed (accounting is not something to be enjoyed) but because it brought another level of knowledge and it effected so many of my future decisions.

After one year at high school, my parents and I were realising that that the high school couldn't offer the right type of stimulation for me. We got recommended the IB-Programme and once the new school year had started I was signed up at at IB and was taking the train everyday to the town that was 40km away.

For those who don't know what the IB-Programme is, you can find an explanation here.

To complete the IB-programme it is required to study at least one social subject. This was not really to my liking as I had often felt social subjects were a hazy area that would not lead to anything The ones I had to choose from was History, Psychology or Economics. Psychology was a straight no, I have always had a cautious approach towards this branch of science and, truth be told, I had not had a positive experience of psychologists which made me want to keep my distance from this subject. With my limited experience I assumed economics was equivalent to accounting, and as I had found the subject, if not fun, at least useful, Economics became my choice.  It was probably the best wrongly based decision I have ever made.

My first lesson began with me receiving a 768 page thick book with the title "Economics - In Terms of The Good, The Bad and The Economist"

Economics- In terms of The Good The Bad and The Economist

I opened it and from that moment I had no memory of what the teacher or my classmates were doing the rest of the course. I sat every lesson with my nose buried in the book, reading articles in the daily newspapers or The Economist and drawing graphs to explain the phenomenons that the articles so blatantly ignored. The book covered microeconomics, macroeconomics, international economics and development economics. I got to understand the reasoning behind micro-loans and what bilateral aid is and how it is used as leverage between companies. I could analyze how decisions effected the flow of money, the class division in a country and how the country's trade would look like. Suddenly every article I read had 5 different diagrams and 7 different analysis , all of them correct.

Since then, economics has been an subject that I will gladly discuss with anyone who is interested. And for those of you who cannot find the charm in economics, I recommend reading "Freakanomics"


Wednesday, 10 April 2013

Going viral

Going viral is such an interesting phenomenon that I found it worth my time to look in to it, as it effects many parts in my life.

For those that do not know whar going viral means; it is the effect of something becoming popular in a very short space of time. It is caused by many people sharing something that they think is interesting or effects them.Cute pictures of kittens are a common surce of going viral but also spam, and chain letters can go viral. Below is a video by Ray William Johnson who comments on the latest viral video clips on youtube.
 .

Being interested in the actual mathematics behind going viral I naturally stumbled across this link where the person has set up some rather nice excel documents modelling the effect of viral growth. The model takes in to consideration two main variables; the viral coefficent and the viral cycle time. Both have an impact, but while the viral coefficent has to be larger than 1 for there to be any viral growth, the viral cycle length has a larger impact on the rate of growth.

I decided to play with the model because I want to test one specific thing that I believe also has a big impact on the viral effect; what type of people that the information is sent to. Using the Wolfram Alpha tool on my facebook data I saw that they had defined some specific categories of people in my network. I will list them below so that it is clear what I am talking about.:

Social insider
A social insider is a friend who shares a large number of friends with you. Social insiders typically appear in the central areas of your friend network. In the language of graph theory, social insiders have a high degree of centrality.
Social outsiders
A social outsider is someone who shares at most one friend with you. Social outsiders typically  appear at the edge of your friend network. In the language of graph theory, social outsiders have a degree centrality of 0 or 1.
Social connectors
A social connector is someone who connects together groups of your friends that are otherwise disconnected. Social connectors typically appear as bridges between separate clusters of your friends. In the language of graph theory, social conectors have a high betweeniness centrality, which is defined as the fraction of shortest connecting paths across the network that pass through an individual.
Social neighbors
A social neighbor is someone with a small number of out-of--network friends (friends of theirs that you don't know). Social neighbors can appear annywhere in your social network - it is their invisible external connections that matter. In the language of graph theory, social neighbors have a small non-ego vertex degree.
Social gateways
A social gateway is someone with a large number of out-of-network friends (friends of theirs that you don't know). Social gateways can appear anywhre in your social network - it is their invisible external connections that matter. In the language of graph theory, social gateways have a large non-ego vertex degree.

Now if something is to actually go viral, the initial network from whence it comes froms needs to contain many Social outsiders or gateways.because without them, it will stay within the initial network. A network that is closed (in the language of graph theory, all the nodes have 0 non-ego vertex degrees), it will not matter how high the viral coefficent is or how fast the viral cycle is, the network will be, after a while, satuated and the viral object will not go further.


I am now playing with my model to see in what way the social outsiders and gateways affect the viral growth.

Tuesday, 9 April 2013

Ill


I'm sitting at home. Fatigue and waves of nausea come and go which stopped me from going to work today (no, I am not pregnant. All nauseous sympotoms in women are not directly linked to pregnancy). The day has pretty much been spent sleeping and watching Doc Martin.


I also got a sudden urge to see what changes has happened to the article I wrote for Wikipedia that was part of one of my favourite courses at uni.

Hamiltongraf


It feels good that some changes has been done to it, but I see several things in it that should be rewritten, as the way I descibed it makes it unclear. So, whoever is interested is welcome to it!

Well I'm going back to bed.